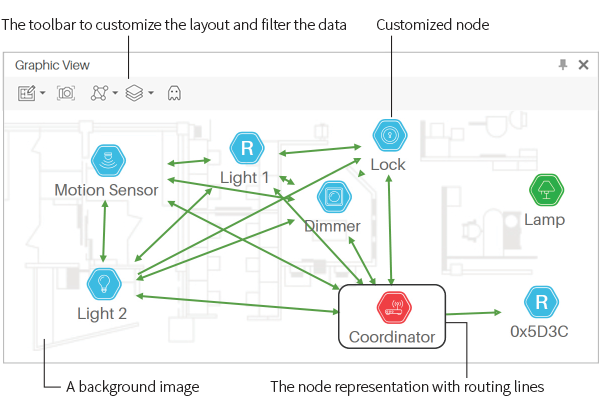
Graph View
This view is a graphic representation of the network topology as interpreted by the current capture data. Each time a new node and address is detected on an incoming packet, such node is included into the representation. The Graph View is composed of a canvas and a toolbar (see the figure below). The canvas contains a network graph showing the current network nodes. The toolbar offers access to options such as adding a background, customizing the network graph layout, selecting what data is shown, and controlling the zoom. This chapter details each of those options.
Changing The Background
To change the background of the canvas, click on the Load Background Image toolbar button (see the figure below). The Open dialog will appear. Select the new background image and click the Open button. You can use images in the .bmp, .gif, .jpg, or .png file formats.
After adding a background to the canvas a Background Tool button appears in the top right section of the canvas area, this tool allows the user to move, zoom and change the transparency of the background image. This tool button can be hidden after use by clicking on the Hide button in the control or in the Show tool menu item in the Background tool button in the Graph View Toolbar.
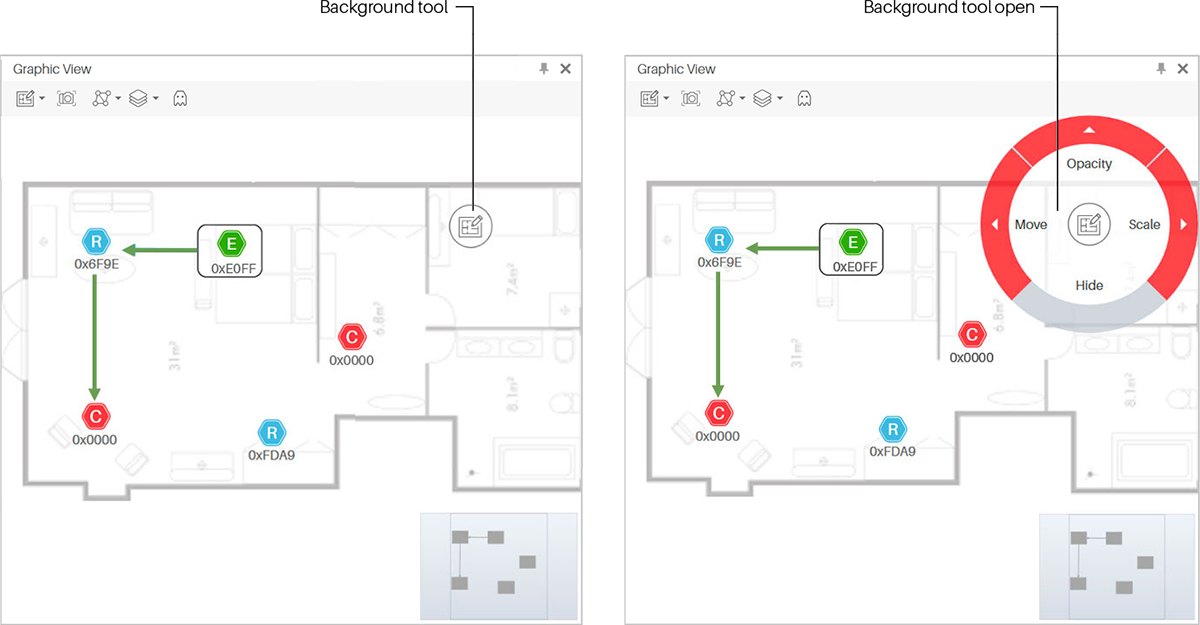
If the Background tool is not visible, you can show it again by clicking the Background button in the Toolbar and selecting the Show Tool Option.
Customizing Nodes
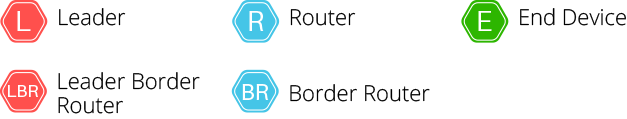
Ubiqua has 4 different default node type icons for Zigbee networks, represented with colored hexagons in 4 different tones. A blue icon represents a router node, a green one represents an end device, a red icon represents a coordinator node and a gray one represents any other case.

For Thread networks, every node state is represented with the initials of every node’s role and type. The L letter represents a Leader node, the R letter represents a Router node, the End Devices are represented with an E letter, the BR acronym represents a Border Router, and the LBR acronym is for a Leader Border Router.
The appearance, position and alias of the nodes can be customized by you. You can change the position of the nodes by clicking and dragging each one within the Graph View. The connecting arrows will move as the node does for persistence. Also, note that for this action is recommended that the Graph and the Network Explorer views are not hidden or auto-hidden.
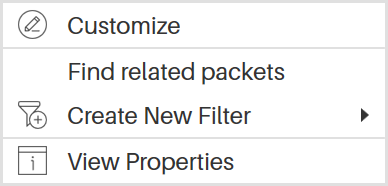
If you want to easily identify the nodes of your network, Ubiqua allows you to visually customize them by letting you change their alias and their icon. To do so, right click on one of your Graph View’s nodes and select the Customize option in the context menu to open this window. The node’s IEEE Address and Alias will be displayed in it, being only the second one available for you to modify.
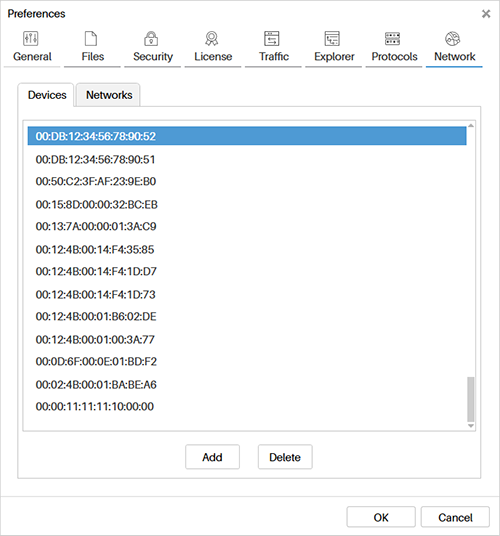
The Customize window can also be opened from the Properties view, clicking the Customize button located in the Customizable Properties expander below the Alias input, as well as from the Properties window, under Network > Devices tabs, a list of devices is displayed where each of them can be identified by their IEEE Address. Right clicking on them and selecting Customize option will also open that window, unlike the window opened from the Graph View, the window opened from the device list displays the Short Address of the selected device. Note that if the device has previously appeared in the network with different short addresses, they will be displayed in a list under the Existing Short Addresses expander.
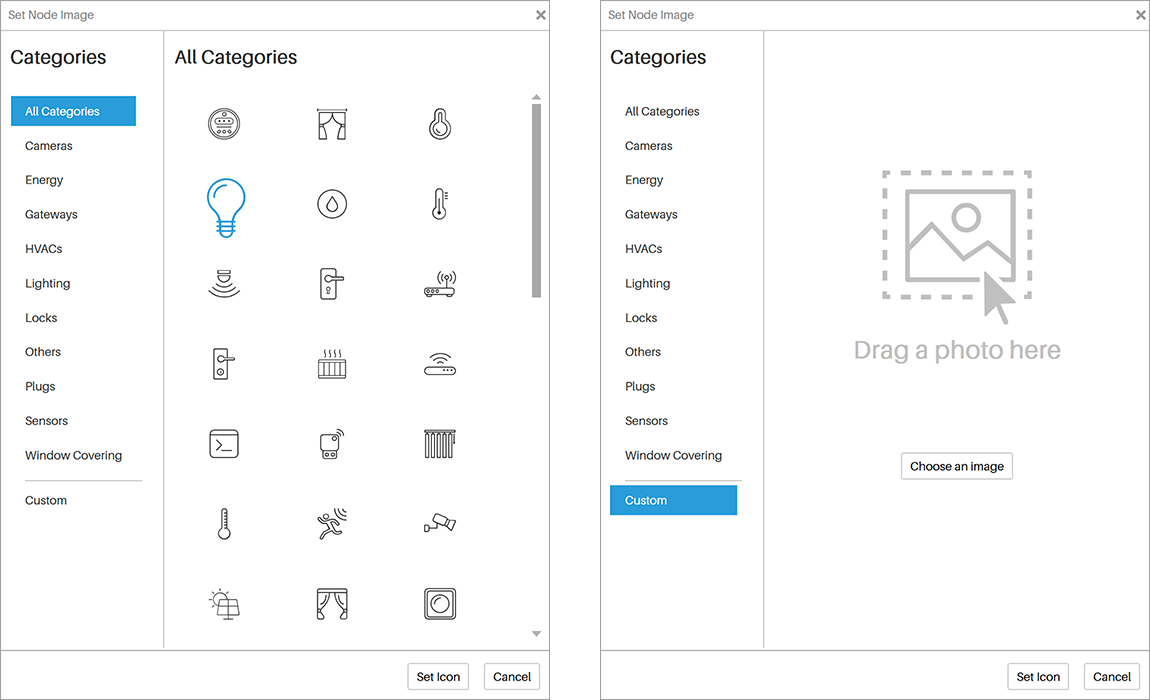
The Customize window also has the function to let you change the node’s icon. In the left side of the window you will see a circle with the legend Change Icon, click on it to open the Set Node Image dialog, which is compound of 2 columns, the left one lists the different categories of the Ubiqua Icon Set for your devices, the right one shows the correspondent icons of the selected category. To assign an icon to your node, click on one of the listed icons and then click on the Set Icon button at the bottom right of the dialog, following this action the icon will be set and previewed in the Customize window. If you prefer to add your personal image files to the network nodes, click on the Custom option at the bottom of the Categories column, after this a drag and drop area will be displayed for you to place your images, below this a button with the Choose an image legend will also appear as an alternative option to open a file locator in your computer to load your images. The chosen images with the Custom option will also be previewed in the Customize dialog. If you want to return the node’s icon to it’s default image you can use the option Remove Icon that is in the context menu of the circle with the image of the node.
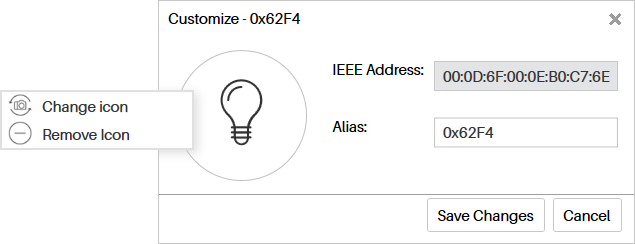
Once you have performed the previously mentioned steps, click the Save Changes button to visualize the node customization, or Cancel to keep the node’s previous properties. If you saved the changes the Graph View will be updated with your new given Alias and Icon properties. When you modify a node alias or icon, this is saved in your configuration, this will help to remember your choice, and when the node appears again in the capture it will use the previously saved data.
Create Filter
Right clicking on your nodes gives you the possibility to filter your Traffic View capture, select the Create New Filter menu item, and a customized filter option for your selected node will appear for you to click it, following this action the Results View will only display those packets related to the selected node.
Changing the Network Layers
Ubiqua shows two kind of relationships between network nodes: Topology and Routing. Each one of these are represented in the Graph View as layers. The Topology Layer for Zigbee captures is constructed by examining the information of the MAC association request/response message and are represented by blue color edges. The Routing Layer for Zigbee captures is constructed by examining the information contain in the Zigbee Network Link Status messages and are represented by green color edges.
Topologies
A set of graphical representations for different network’s behaviors can be displayed in the Graph View. The Joining Topology, Link Status Topology and One Hop Link Topology are the algorithms that take the data capture as input and visually display different aspects of the network.
To visualize the different topologies click the Layers button in the Graph View toolbar and then check any of the topology radio buttons, following this action the graph will re-accommodate in the view and the edges will be painted with a different color based on the selected topology.
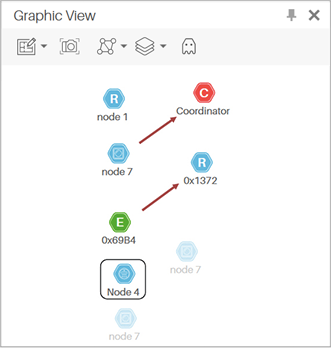
Joining Topology
This Graph View’s topology representation is given from the association of the nodes to the network according to the rules of the Join Process, where every node has to pass the association process before being allowed to send data over the network.
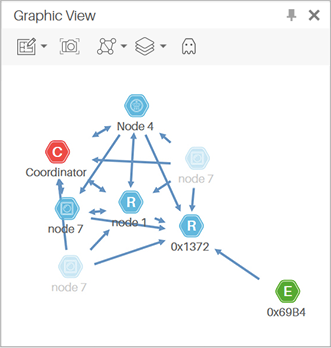
Link Status Topology
This topology displays the current connections of the network according to the Link Status (Routers) and Data Request (End Devices) messages of the data capture.
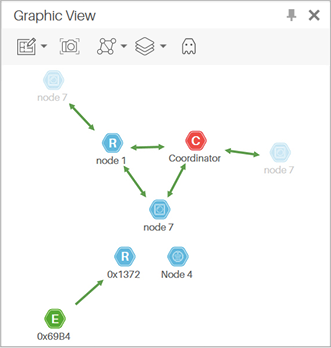
One-Hop Link Topology
This topology displays the network’s connections using one hop communication between devices, one hop is defined as the MAC source and MAC destination pair in a packet.
Spanning and Zooming
To span the Graph View, click on any free space on the canvas and drag the mouse cursor. For zooming use the Overview map control or use the mouse wheel button.
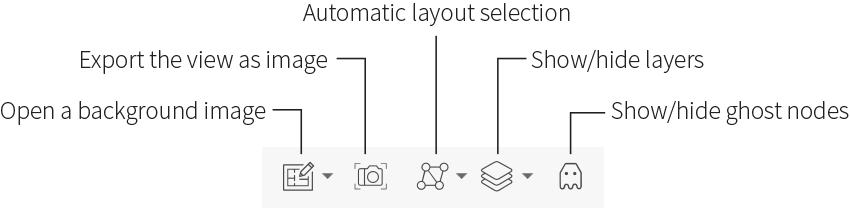
Exporting Images
The Graph View has a feature useful to share the visual representation of the network. You can export the contents of the view as an image. To do so, click on the Save Image toolbar button. The Save dialog will appear, select the location and the file format and click the Save button. You can save images in the .bmp, .gif, .jpg, .png, or .tif file formats.
Filtering Nodes
The Graph View has the ability to hide and show nodes based on their PAN ID or corresponding communication channel. To do this select the Network Nodes option from the Layers toolbar in the Graph View, and select the way you want to Show/Hide the nodes, either by channel or PAN ID; next a list of the selected items will appear. To show an item just click to show a check mark, to hide it click the item for unchecked.
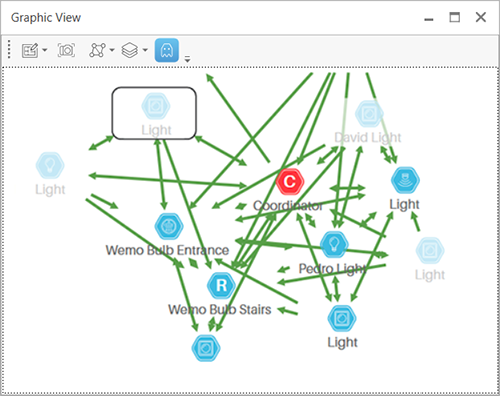
Ghost Nodes
The Graph View is the visual representation of the nodes that are part of the network, Ubiqua also allows you to see those nodes that have joined and then leaved the network during a current capture, this nodes are visualized in the topology with a clearer opacity than those nodes that are currently connected to the network, the incidence to the nodes to which they were connected will also be displayed.
If a node connects multiple times to the network, will also be reflected in the topology, drawing each one of the times that this node joined the network during the capture in the Graph View. To be able to see this behavior click the Show ghost nodes button in the Graph View toolbar.