Traffic View
The Traffic View is the most feature-rich component in Ubiqua. This chapter describes the full functionality of the Traffic View including instructions on topics such as: how to manage capture files, the actions that can be performed with packets selected on the grid, how to filter packets, and other related features.
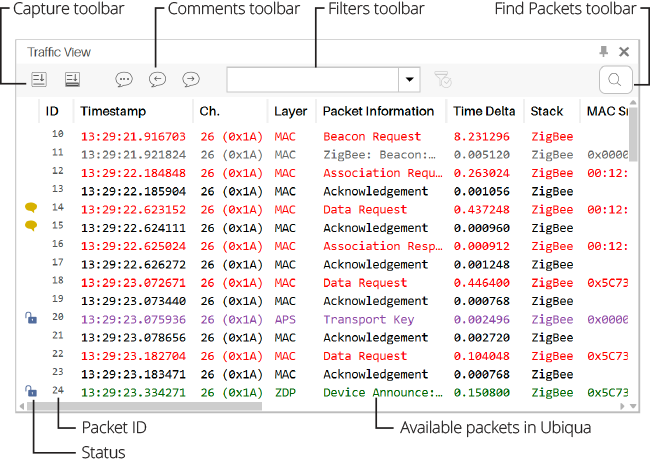
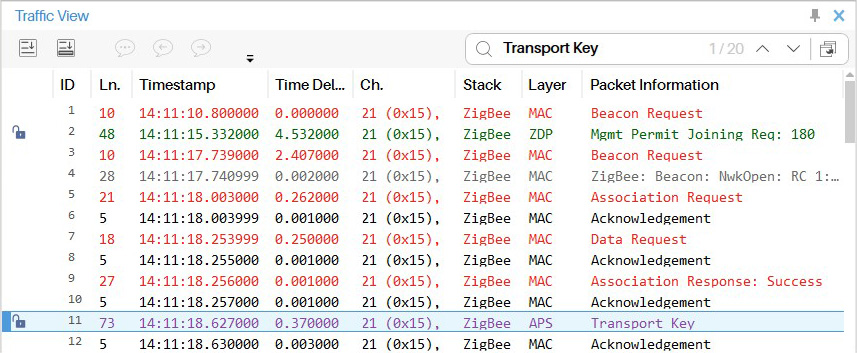
The Traffic View is mainly composed of 2 components: a grid, and a set of toolbars (see the figure below). The grid shows all the packets captured with devices or loaded from capture files. Toolbars provide access to most of the functionality available throughout the system and because of this, the Traffic View can be seen as the central point of Ubiqua. Many of the actions performed on it produce changes or updates in other views. For instance, selecting a packet on the grid changes the Packet View contents. Also, actions in other views could cause the Traffic View to update its contents. For instance, starting a sniffer in the Adapter Manager will cause the grid to update itself to show incoming packets.
The following image depicts a Traffic View with some packets captured. Also, note that the first column shows an icon that depicts additional information about the packet on its corresponding row, for example whether there’s a comment for the packet (call out icon), if there was an error when decoding (cross mark icon) or if the packet was encrypted (closed lock) and the decryption was successful (open lock).
Columns
Ubiqua provides detailed information of every captured packet displayed in the Traffic View, these are segmented by columns in order to make them easier to be understood. As a user you can determine which columns will be shown as well as their display order.
To select which columns will be displayed, right click on any of the column headers, following this action a context menu will appear with an option list for you to check those you want to be shown. At the end of the list is the More options button, by clicking on this, the Preferences window will open displaying the Traffic tab, here you can also check the options to be displayed in the Traffic View, as well as sorting them in descending order by dragging and dropping them, this to customize the display order of the columns.
Note that the column order can also be modified directly from the Traffic View, by dragging and dropping the column headers in a horizontal way.
The Traffic tab in Preferences also allows you to customize the width of the Traffic View columns, to do so, click on any of the options from the checklist, after this a text input below with the label Width of the selected column (in pixels) will be enabled for you to type the width you want to assign to that column.
At the bottom of the Traffic tab there are 2 radio button to set the Timestamp column format, you can choose the Date and time or the Only time format, to apply this and the previously mentioned customizations, click the OK button, otherwise click Cancel to discard the changes.
Status
The Traffic View’s first column displays a set of icons with a color assigned depending on its status to depict additional information about the packet on its corresponding row, can be one or multiple displayed to provide a more helpful way to identify the packet status:
| Icon | Status Name | Description |
|---|---|---|
 |
Decrypted | Ubiqua was able to decrypt the packet. |
 |
Encrypted | Ubiqua was not able to decrypt the packet. The Packet Information column will also display the text Unable to Decrypt. |
 |
Error | If there was a decoding or packet error such as Exhausted Data, Unused Data, Wrong Protocol or Undefined Trigger. |
 |
Fragmented | Indicates that this packet has a fragmented payload, when all the packets are received, the application will reconstruct the packet with all the fragmented payloads. |
 |
Compressed | If a packet has a bit-rate reduction. |
 |
Commented | If a comment has been added to the packet. |
Color Codes
The Traffic View provides a helpful coloring scheme to easily identify the layer and protocol for each packet captured. The following table lists the available options:
| Color Name | Layer | Protocol |
|---|---|---|
| Dark Green | TCP | Thread, Zigbee IP, IP |
| Dark Green | UDP | Thread, Zigbee IP, IP |
| Dark Green | ICMPv6 | Thread, Zigbee IP, IP |
| Dark Green | HTTPS | Thread, Zigbee IP, IP |
| Dark Green | PANA | Thread, Zigbee IP, IP |
| Dark Green | mDNS | Thread, Zigbee IP, IP |
| Dark Green | MLE | Zigbee IP, IP |
| Orange | MLE | Thread |
| Light Green | CoaP | Thread, Zigbee IP, IP |
| Dark Blue | Ethernet | Thread, Zigbee IP, IP |
| Purple | HTTP | Thread, Zigbee IP, IP |
| Orange | SE2 | Zigbee IP, IP |
| Orange | JenNet-IP | JenNet-IP |
| Gray | MAC-Beacon | Zigbee IP, Thread, Zigbee |
| Brown | Mac-Data | Zigbee IP, Thread, Zigbee |
| Black | MAC-Acknowledgement | Zigbee IP, Thread,Zigbee |
| Red | MAC-Command | Zigbee IP, Thread, Zigbee |
| Red | NetBios | Zigbee IP, Thread, Zigbee |
| Gray | PopNet- Beacon | PopNet |
| Brown | PopNet- Mac-Data | PopNet |
| Black | PopNet- MAC-Acknowledgement | PopNet |
| Red | PopNet- MAC-Command | PopNet |
| LightGreen | PopNet-APP | PopNet |
| LightBlue | PopNet-NWK | PopNet |
| Black | Pop-Nwk_Acknowledgement | PopNet |
| Purple | DHCPv6 | Thread, Zigbee IP, IP |
| Purple | DTLS | Thread, Zigbee IP, IP |
| DarkGreen | ZDP | Zigbee |
| LightGreen | ZCL | Zigbee |
| Purple | APS | Zigbee |
| DarkBlue | NWK | Zigbee |
| DarkBlue | NWK-GP | Zigbee |
| LightBlue | 6LowPAN | Zigbee IP, Thread |
| DarkGreen | EAP | Zigbee IP |
| LightBlue | IPv4 | Thread, Zigbee IP, IP |
| Red | IPv6 | Zigbee IP, Thread, Zigbee, IP |
Timestamp & Time Delta
The Timestamp columns displays the exact date and time when a data packet was captured. You have the possibility to choose one of the 2 formats in which the information can be displayed, the Date and time or just the Time format. To configure it, click the Tools > Preferences menu item, and then select the Traffic tab, at the bottom of the tab body are the Date and Time and Only time radio buttons, select one of these options and then click the OK button to determine the format in which information will be displayed in the Timestamp column.
The Time Delta is the time interval between 2 captured packets, which is calculated based on the elapsed time from the previous packet regardless of its source network or channel. In case a data filter is applied to the capture, the time intervals will be recalculated based on the result.
Capture Files
Ubiqua uses capture files not only to store the packets you see in the Traffic View, but also to store other data such as the layout and settings of the nodes in the Graphic View, or the security keys used for decoding. When saving a capture, the data available in all views is retrieved and stored into a new file. Note that this process does not store decoded data, so when you open a capture file all the stored packets will be decoded again to populate data in all views.
Saving Capture Files
To save the available capture data into a new file follow the next steps:
-
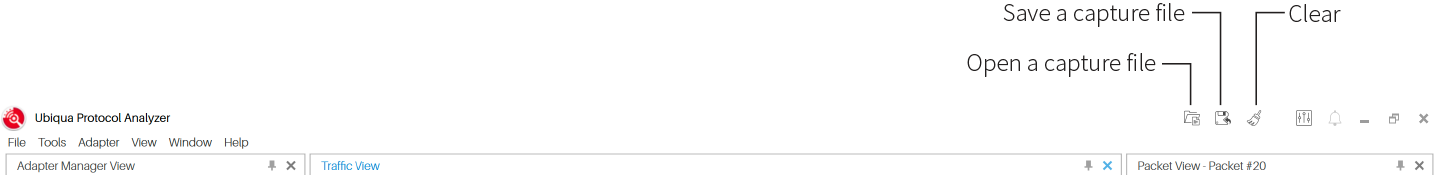
Start the Save As dialog by either selecting the
File > Save Capture Asmenu item, clicking the Save Capture quick access tollbar button, or pressing Ctrl+S on your keyboard. -
Select the location where you want to store the new capture file, specify the file name, and press the Save button. Ubiqua capture files have the .cubx file extension but you can also save the capture in the .subx .dcf, .pcap, and .pcapng file formats.
N.B.: It is recommended using the .cubx file format, as this format supports more features in the capture such as comments, security keys, sniffer information, etc.
- A progress bar showing the progress will appear in the status bar.
Opening Capture Files
To open a capture file follow the next steps:
-
Start the Open dialog by either selecting the
File > Open Capturemenu item, clicking the Open Capture quick access toolbar button, or pressing Ctrl+O on your keyboard. -
Select or specify the capture file and press the Open button. Additionally to its own .cubx format. Ubiqua supports opening captures in a number of other file formats such as .subx, .dcf, .pcap, and .pcapng.
N.B.:If the file does not have information about the protocol needed to decode the data and if the user has not set a default protocol in preferences, a dialog will be presented with the available protocols to decode the capture.
- A progress bar showing the opening progress will be displayed in the status bar. Note that depending on the file size (directly related to the number of packets stored), this process may take some time as the contained packets are being decoded on the fly to populate data in the corresponding views.
Clear
The clear functionality resets all the information available for both nodes and packets of the capture (see below). This functionality is accessible from the Clear Capture (packets and nodes) quick access toolbar button.
The types of data to clear are:
-
Packets – Removes all the packets in the Traffic View and Results View.
-
Nodes – Clears the nodes information in the Graphic View, the Network Explorer and the Properties View.
Merge Capture Files
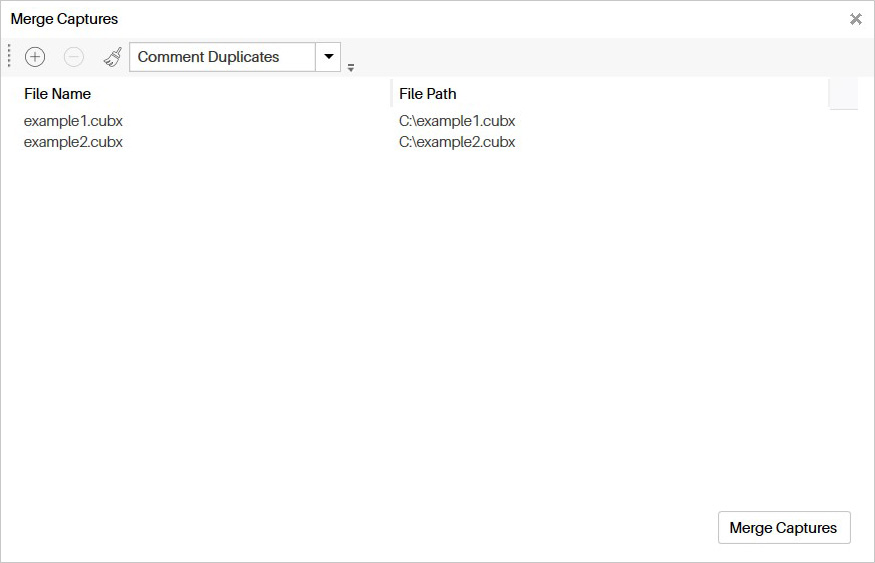
This feature allows the user to merge .cubx files. This process consists in bringing together in one file all the packets from the different source files, order them chronologically and — for the case of Zigbee frames — detect duplicates and mark them with a comment or delete them.
To use this feature click on menu Tools > Merge Captures or press Ctrl+M on your keyboard, after this action a dialog window will appear on your screen; In the toolbar area of the window there is the Add Capture button, that allows you to add the capture files to merge to a list, a maximum of ten files is allowed to be added to the list, as a second option is the Remove button that works once the capture files have been loaded, and has the function of removing one of the files of the list, just clicking the item you want to delete and then clicking the Remove button on the toolbar, next to it is the Remove All button, that clears the element list just pressing this button or with the Ctrl+Delete combination on your keyboard. Finally there is a combo box with 2 options, the default option Comment Duplicates that adds a comment to those packets that are duplicated, and the Remove Duplicates option that deletes those packets that appear more than once in the merged capture file.
Once you have a list of selected files click the Merge Captures button at the bottom right of the window, after this action, a browse window will appear for you to indicate where do you want to save the merged file and how you want to name it, then save it.
Once the new file is generated a notification will appear asking if you want to open the new merged file, if you accept press the Yes button, and the new file will be loaded on the Traffic View, if you want to open it later, press the No button or just close the notification, following this action the merged the file list will be cleared, letting you make a new merge if needed.
Auto Scroll and Selection
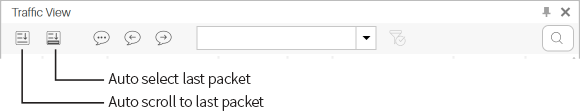
The Traffic View features two options that are useful to track the latest packet on the grid, this options are Auto Scroll and Auto Select. The Auto Scroll option moves the scroll position to bring into view the latest packet captured, while the Auto Select option selects the latest captured package (which also brings its contents into the Packet View). To activate or deactivate this options, use its corresponding toolbar toggle buttons (see the figure below).
Commenting Packets
Ubiqua features the ability to annotate the packets shown in the Traffic View. Capture files store this information so you will be able to share insights about packets with other Ubiqua users, or just give you the opportunity to store notes about your capture analysis.
To start using comments, select a packet on the grid. Right click on it to open the contextual menu and select the Add Comment menu item. The Comments dialog will appear (see the figure below), write your notes and press the OK button. To see the comment, just move the mouse cursor over the row header and it will display the comment on a tooltip. To delete a packet’s comment from the grid, right click on it, and select the Delete Comment menu item.
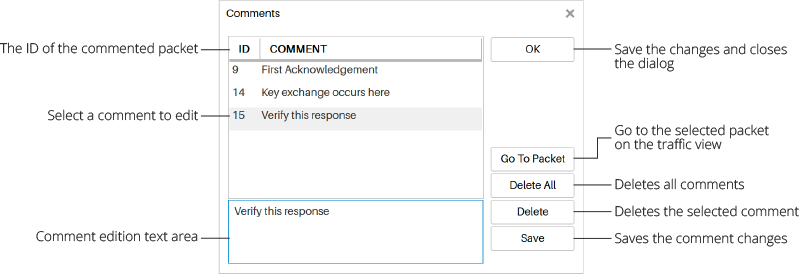
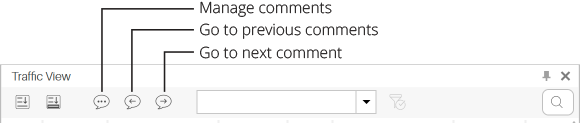
The comments toolbar has 3 buttons (see image below), the first one opens the Comments dialog (where you can edit or delete the comments) and then there are the Previous and Next Comment buttons that you can use to move the scroll of the grid and select the previous or next commented packet.
Go To Packet
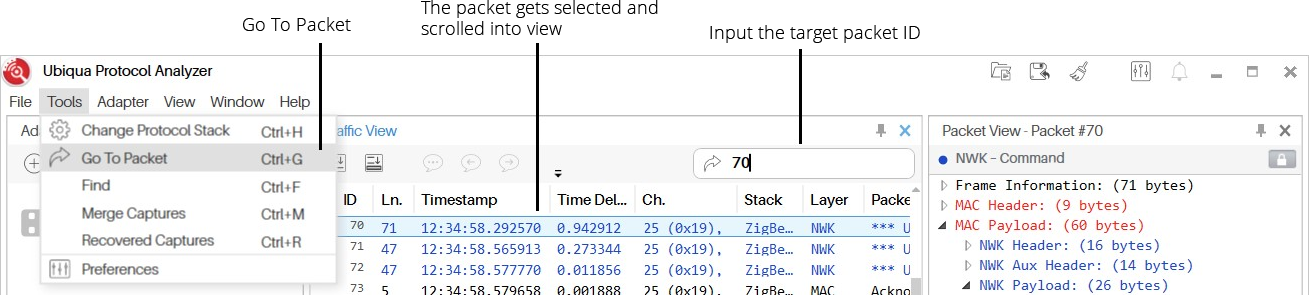
The Go To Packet tool lets you search packets in the Traffic View and Results View by their ID number. To start using it, click the Tools > Go To Packet menu item, or press Ctrl+G on your keyboard, after this a text input will expand at the right side of the toolbar view where you will have to type the ID of the packet you are looking for, then press the Enter key. The grid will scroll to the packet position and it will be highlighted. To close this tool you have to press the Esc key.
Find in Packets
This tool allows you to quickly make a string search of the information contained in the Traffic View, either from a live or saved capture, it can be accessed in three different ways:
-
By clicking the
Tools > Findmenu item. -
Pressing Ctrl+F on your keyboard.
-
Or by clicking the search icon located on the right side of the Traffic View’s toolbar.
After executing one of the listed actions, the search icon container will expand to display the Find bar, there you will have to enter the text with the keyword you are looking for. If the keyword does not match with any information contained in the Traffic View, a label will display the message: No results found, otherwise it will show the total number of packets containing one or more instances of the search text, right after the result number currently selected. Click on the up and down arrows to navigate the find results. At the right side of the Find bar is the Show all matches in Results View button, when pressed it displays the search results in the Results View.
Changing Protocol Stacks
This feature allows you to change the protocol stack of the packets already available in Ubiqua. The change protocol process will clear all the current capture data, apply the changes you selected, and then re-decode all the packets, producing new capture data. To start the process you must stop all capturing adapter, then click the Tools > Change Protocol Stack menu item or press the Ctrl+H keys on your keyboard. The Change Protocol Stack dialog will appear (see the figure below). On it, you will have the choice to set what protocol stack will be used to re-decode the packets on a given channel (for a list of the available stacks see Supported Protocols).
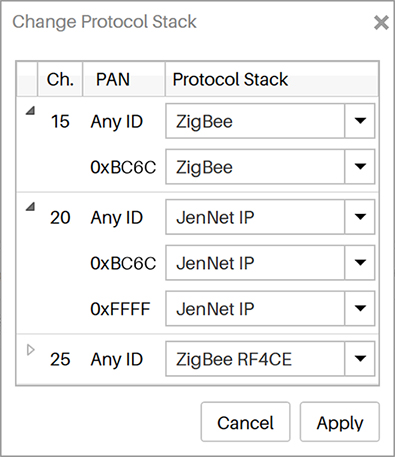
There is also the option to set a new protocol stack in combinations of target channels and PAN IDs, giving you a fine-grained control over the changes. Once you have selected the new stacks, press the Apply button. After this point, all capture data will be cleared and the packets will be re-decoded using your settings (a progress bar will show you the status).
Please note that devices retain their own protocol setting. The change protocol stack feature only affects previously captured packets.
Filtering Packets
There are certain times in which you don’t want to see all the captured packets, but a subset of them. To help with the overload, Ubiqua features the ability to filter packets and show only the ones that fulfill a certain logical expression.
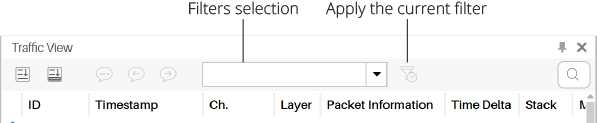
Filters are managed through the filters dropdown located in the Traffic View’s toolbar (see below).
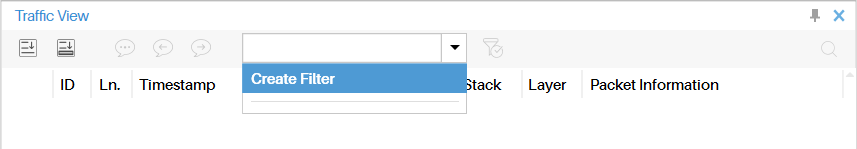
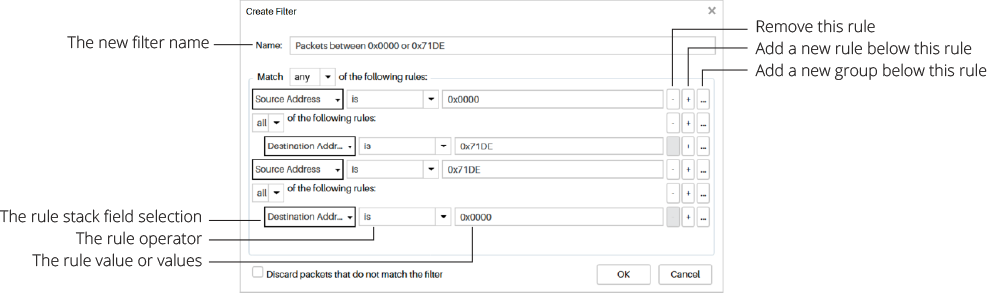
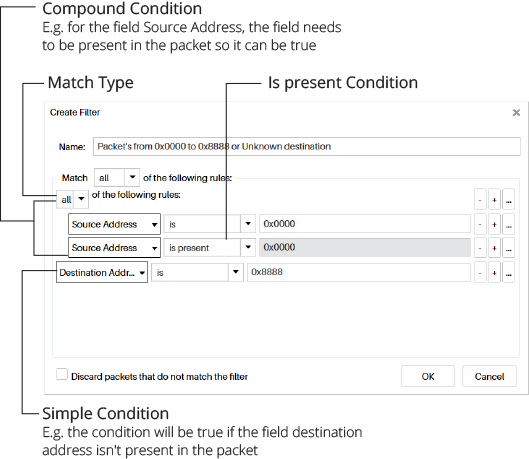
To create a new filter click the Filters dropdown and select the Create Filter option. The Create Filter dialog will appear (see the figure below). The dialog allows you to define filters by combining a set of rules grouped by a match all or match any operators. Each rule is composed of a field, an operator, and a set of values. Also, you have the possibility to specify subsets of rules for complex scenarios. A field is an element whose value can be obtained by decoding the packet, the operator defines the condition the field value must comply, and the set of values (which can vary depending on the used operator and the data type of the field) specify what are the expression values that will be used to evaluate the rule. Make sure to name your filter at the top of the dialog in the name input to easily identify it at the time you need to apply it.
The figure below shows an example. Once the filter has been created it will be added to the Filters dropdown, there you will be able to select it by clicking on it, and you have to click the Set Filter toolbar button to apply it. If there is not enough decoded information available to compute the filter, packets will be decoded again to retrieve any additional data needed to finally apply the filter. Once a filter has been applied, Ubiqua will display in the Results View only the packets that the filter allows, even when capturing new packets from devices. Every filter can be modified or deleted with the Edit Filter and Remove Filter buttons.
Filters are not stored on capture files. They will be stored on the environment and they will be available as long as you don’t delete them.
The filter’s condition will be true when the field that is being filtered is not present in the packet, this works with all the operators except for the operator IsPresent, if you want to filter a field and it needs to be present in the packet then you need to make a compound condition for the field where you add the main condition of the field and another condition for the same field using the operator IsPresent for the field, note that this compound condition needs to have the the matching type all.
Exporting Packets
If you need to extract packets of your capture and you need them on a different file format (not just a capture file), you can export the selected packets on the Traffic View. To start the export process, select the packets you want to export, Go to the File > Export Packets item. Note that in order to select packets in the Traffic View, you must disable the Auto Select last packet option.
You can export either all the packets or only the selected packets in the following file formats: .xls (Microsoft Excel spreadsheets), .csv (Comma Separated Values), .opml (Outline Processor Markup Language), and .txt (simple text files). The .opml and .txt file formats will include all the decoded data of the packets while the .xls and .csv file formats will only include the data shown in the columns of the Traffic View.
Copying a Packet
You can copy a packet as it appears in the Traffic View or the Packet View’s tree by selecting the packet you want to copy; right click on the selection and choose the Copy menu item. The clipboard will store the selected packet data and it can be pasted in any text editor. When traffic is being captured in fast rates, it is recommended to disable the Auto Scroll option to easily select the packet from the Traffic View.